Candlestick Trading - Tips and Tricks for Reading Candlestick Charts
Candlestick were first used by the Japanese in the 17th century. They were refined and developed into the candlestick charts used today in the early 1900s. They have been given a resurgence with the trading strategy known as 'Price Action', which is a bare bones approach to trading where most of indicators are removed and 'Price' becomes paramount.
Like any trading system candlestick, while important indicators, should be used in conjunction with other indicators and methods that provide the context for decisions such as overall trend and lines of resistance and support for previous price movements.
There is a lot of information already available about Candlestick trading and 'Price Action.' This article summarizes and condenses this information as a guide to the novice trader who may be considering using candlestick charts for their trading.
It particularly focuses on how time intervals such as 1-day, 4-hour, 1-hour, 15-minutes and 1-minute affect the interpretation of candlestick charts.
What are Candlestick Charts?
What are Candlestick Charts and How are They Used for Trading
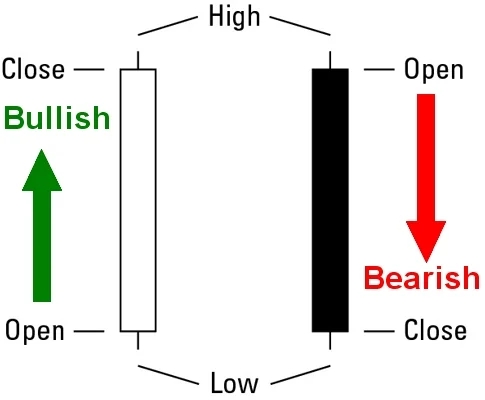
A candlestick summarises the price data for one unit of time that you are interesting in - from 1-day to 1-hour to 1-minute. A candle is constructed using the opening price, closing price, and high and low prices throughout the time interval. The body of the chart is formed using the opening and closing prices. The long thin lines above and below the body are referred to as 'tails', 'wicks' or 'shadows'. If the stock ranges above and below the opening price there will be a tail extending to the maximum and minimum closing price throughout the day. If the stock closes higher than the opening price the candle is referred to as a bullish candle. It is generally shown as 'white' or unfilled, or 'green'. If the stock closes lower than the opening price the body is shown as 'black', filled or 'red'.
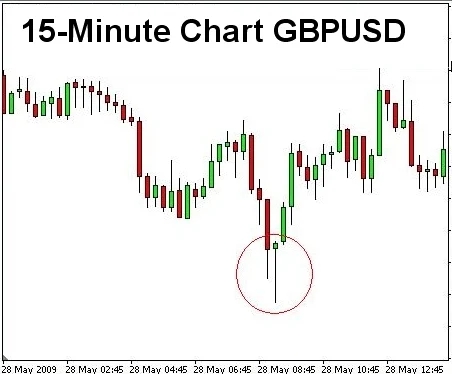
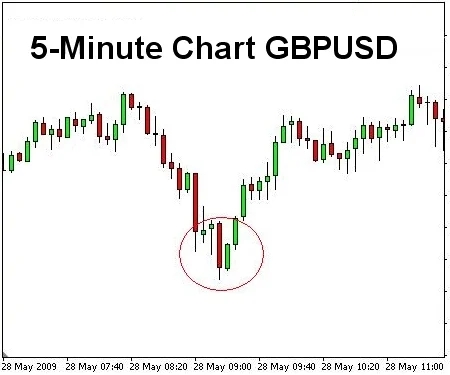
Sample charts for BGPUSD are shown below using two time intervals: 15 minutes and 5 minutes. This shows how the timeframe affects the appearance of the candlesticks. More about this later. Both charts show a major reversal of the price on 28th of May.
Major Candesticks Patterns Used as Trading Signals
There are more than 50, perhaps hundreds of candlestick patterns that have been identified and used for trading. However there are only about twelve 2-day, 3-day and 4-day patterns that a novice trader should be familiar with. These major patterns are discussed below.
What Do Changes in the Pattern over Several Days Signify?
It is important to understand that the candlestick patterns, like any other indicator, are followers of previous actions or events, namely how the price change in the last time intervals. The signals shown by the candlestick patterns are just that a signal that something might happen in the future based on what happens in the past. As you become more familiar with candlesticks you realise that you can only use them properly when you learn to look beyond the patterns and signals, to understand what has happened in the market to produce the pattern.
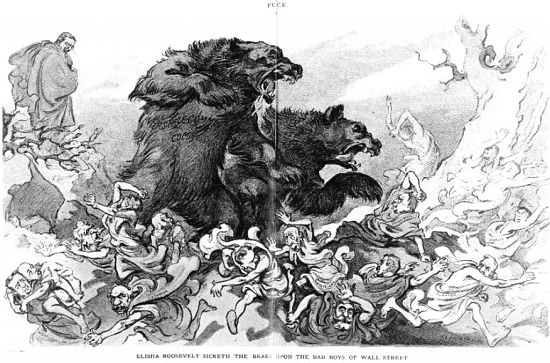
Essentially this involves learning to understand the internal forces of price, demand and supply which create the changes in price reflected in the candles. It is simplistic but most people describe the events that generate the candle pattern as a shift in the balance of power between the bears and the bulls, between those who are focused on price increases and those focused on price decreases.
Understanding how the candlestick pattern changes and what causes these changes is the key to using candlestick patterns and signals in trading. Like trends there is a very subjective side to it. Most traders develop a bias towards which way the price will move based on trends, lines of resistance and the candle patterns themselves. Traders continually reassess the bias an like trends are reluctant to alter that bias or beliefs until they get the right signals and other information to change their mind.One a reversal or trend-following patterns occurs traders are locked-in to this new bias and are reluctant to change their mind once again. This is what following a trend and bias, or belief, is all about. Market analysis is simply analyzing the new information and deciding whether it supports your existing bias or is adequate to change your mind as adopt a new bias.
Understanding the Context for Interpreting the Chart patterns
It is important to reinforce some of the key elements of the context for trading:
- Resistance and Support
- Trading with the Trend is important in various time frames
- Predicting future Price Movement is a matter of improving the probability of what could happen, but there is no certainty. Likewise the addition of more chart pattern signals and other supportive evidence from momentum indicators and other signs helps to improve the probability of the predicted outcome.
- Trading decisions shown never be based on interpretation of the chart patterns and signals by themselves. Always look for other lines of evidence that support the interpretation. This means using other indicators such as MACD, RSI, CCI and Williams - to name a few.
- Risk management should be paramount for all trading decisions.
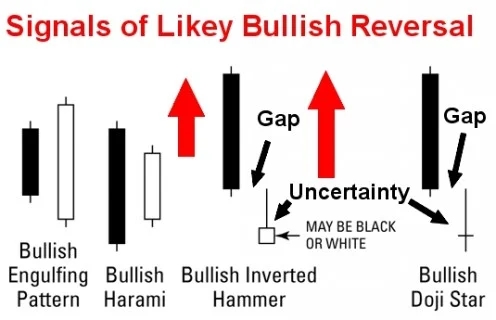
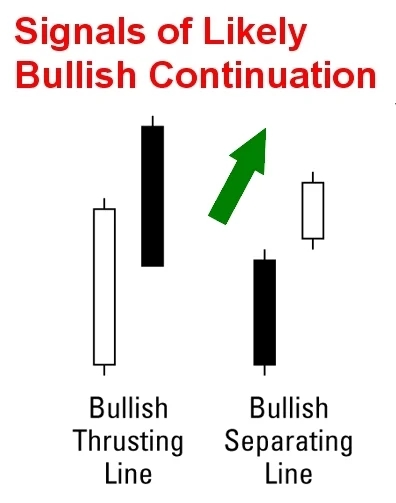
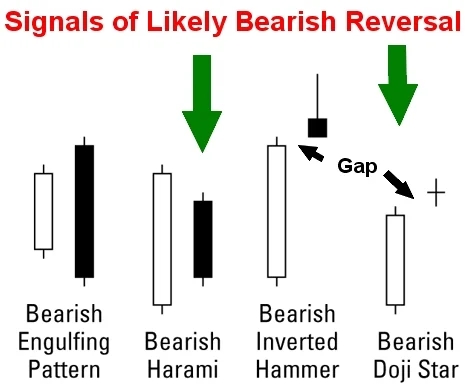
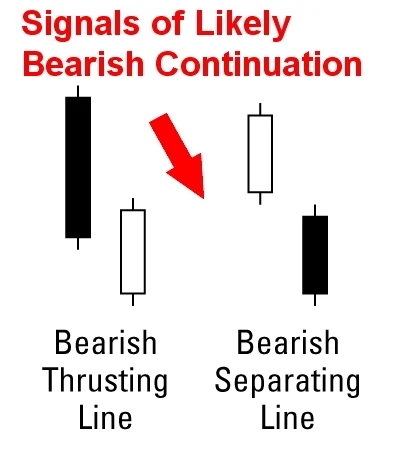
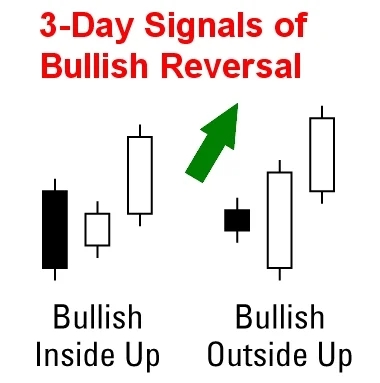
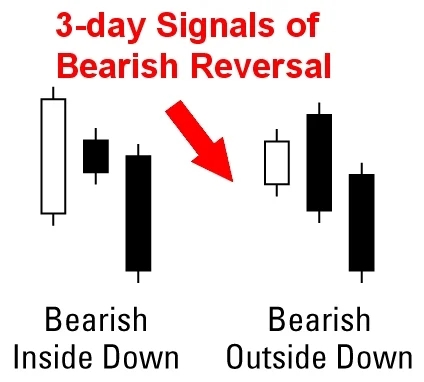
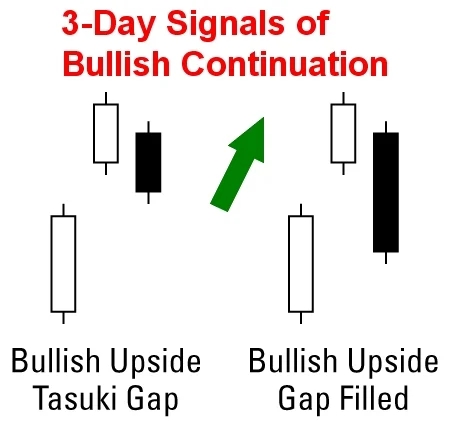
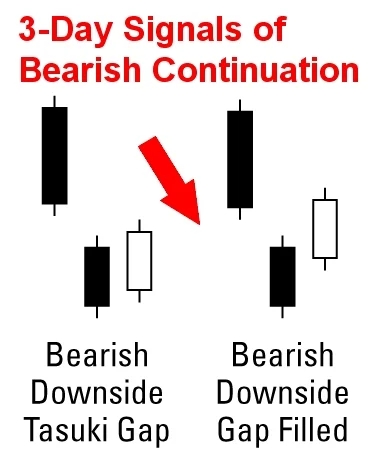
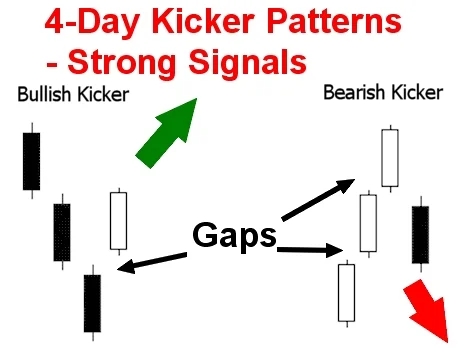
Chart Patterns for Recognising Signs of Reversals and Continuations of Trends
The images below provide a summary of the key patterns for recognising signals for making trading decisions. There are may excellent articles that describe these patterns. See this Introduction
How the Time Frame Affects the Candlestick Pattern
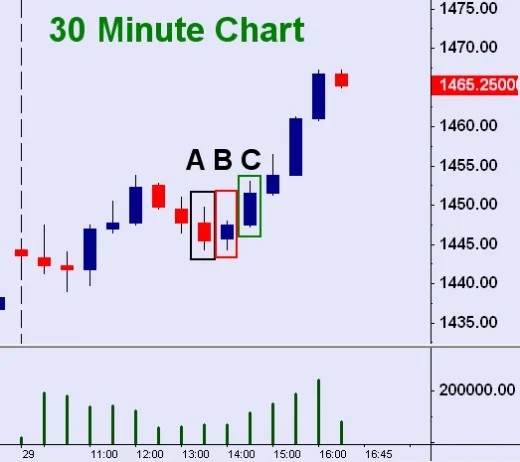
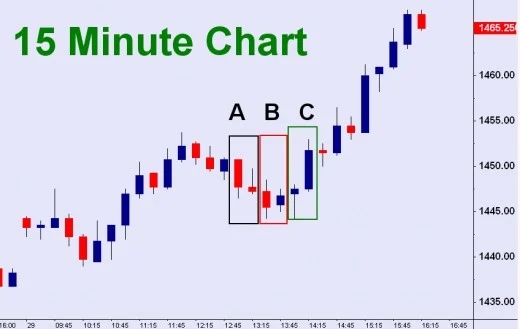
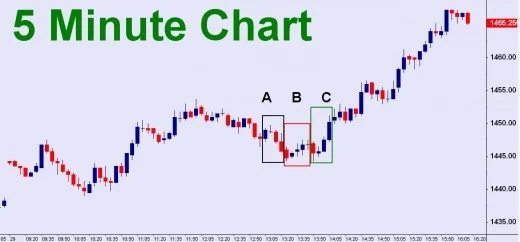
As the chart above shows the chart pattern changes for different time intervals.
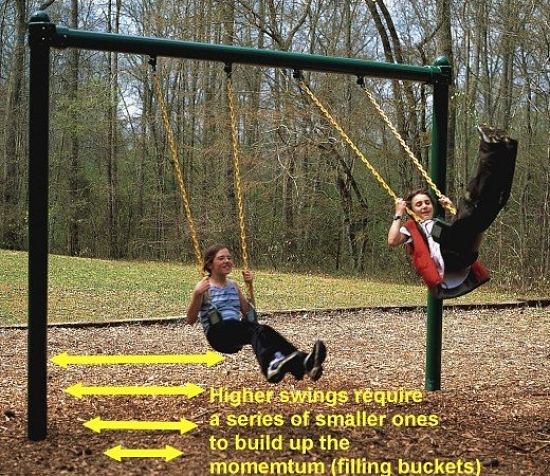
A single candle at 30 minutes averages the results for 2 candles at 15 minutes and 6 candles at 5 minutes. However the overall patterns don't chance, but the signals are different. As shown in the image below it often pays to be patient and allow multiple signals to develop to confirm your bias. In this case there were signs of resistance and reversion before there was a strong sustained bullish swing. In many ways the need to wait for signs of major reversions is similar to that described for using CCI, visualized as 'buckets', in a previous article about trading.
Be Patient! Wait for the Change You Expect
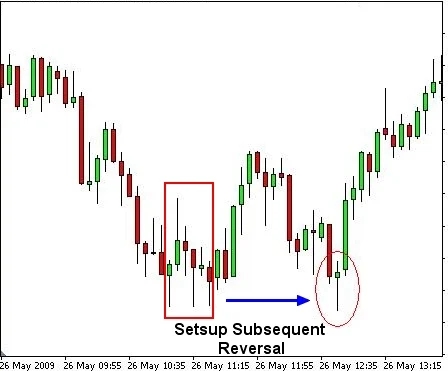
Overcoming Gravity (Reversal) May Require Multiple Swings